

New - Just Now
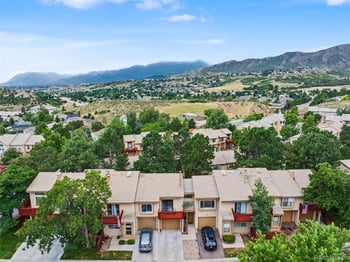
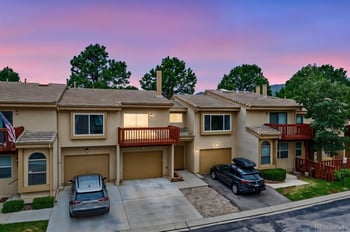
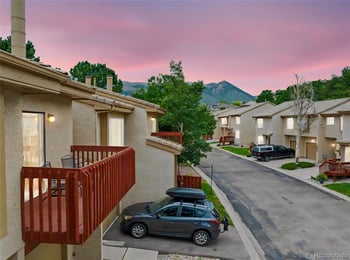
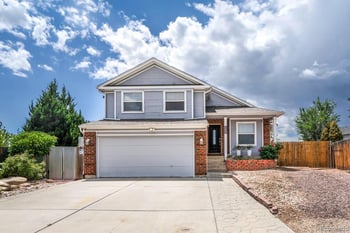
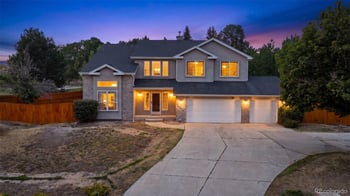
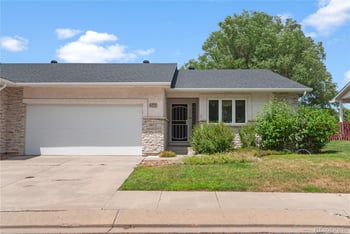
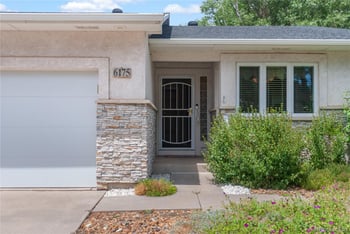
$299,999
Active
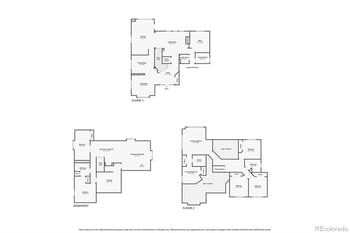
2
Beds
1
Baths
1090
Sqft
0.06
Acres
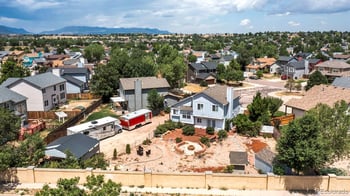
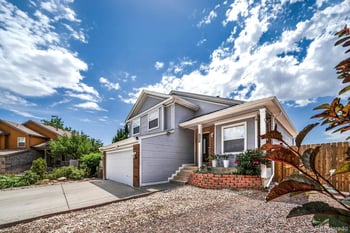
2021 Austrian Way, Colorado Springs, CO 80919
MLS#: REC8335553
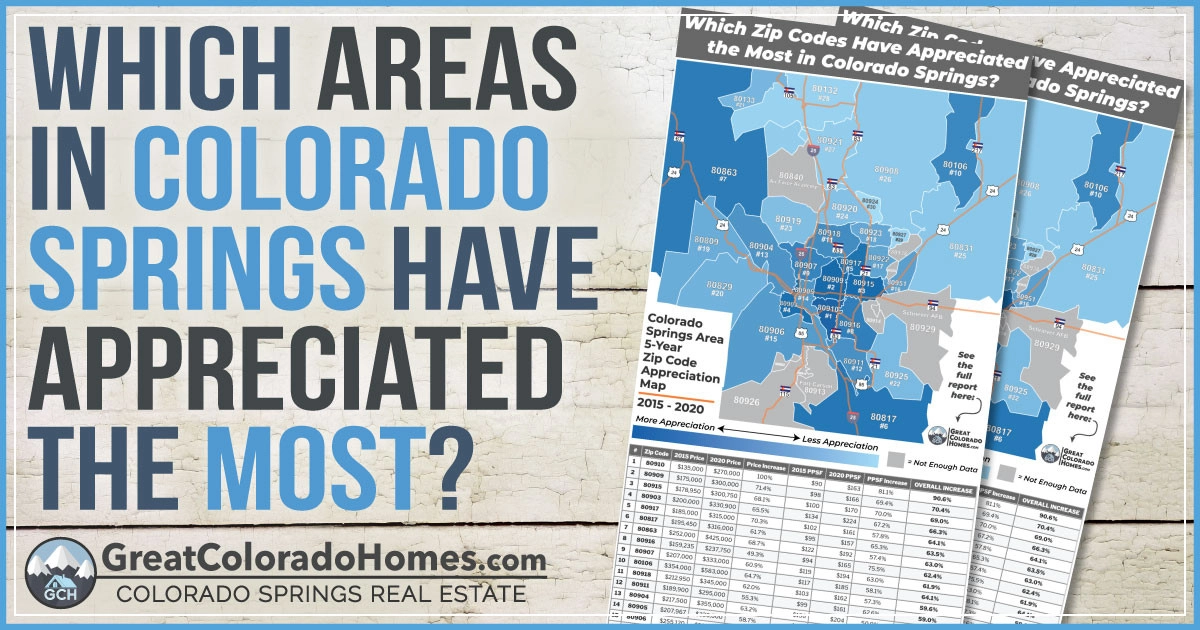
We analyze data from the Pikes Peak MLS every three years to determine which zip codes have appreciated the most over the last five years. This helps us understand where home values have appreciated the fastest in Colorado Springs. The insights we discover are valuable for real estate investors and home buyers.
To accurately measure appreciation, we didn’t just look at sales prices. We combined median sale prices with price per square foot to provide a clearer view. The spreadsheets below contain all this detailed data, ready for you to dive in and draw your own conclusions.
Click on any zip code listed to see homes for sale in that area. It's a great way to learn about the different parts of town.


| # | Zip Code | Price Increase | PPSF Increase | OVERALL INCREASE | 3-Year Change |
|---|---|---|---|---|---|
| 1 | 80809 | 76.0% | 56.4% | 66.2% | ⬆ 18 |
| 2 | 80915 | 59.3% | 68.9% | 64.1% | ⬆ 1 |
| 3 | 80916 | 62.1% | 64.4% | 63.3% | ⬆ 5 |
| 4 | 80910 | 62.0% | 59.8% | 60.9% | ⬇ 3 |
| 5 | 80907 | 53.3% | 64.2% | 58.7% | ⬆ 4 |
| 6 | 80863 | 52,8% | 62.0% | 57.4% | ⬆ 1 |
| 7 | 80817 | 55.8% | 57.8% | 56.8% | ⬆ 1 |
| 8 | 80829 | 54.0% | 59.4% | 56.7% | ⬆ 12 |
| 9 | 80911 | 52.6% | 60.6% | 55.6% | ⬆ 3 |
| 10 | 80133 | 58.5% | 52.9% | 55.7% | ⬆ 11 |
| 11 | 80917 | 54.7% | 56.3% | 55.5% | ⬇ 6 |
| 12 | 80922 | 55.2% | 54.8% | 55.0% | ⬆ 5 |
| 13 | 80923 | 50.0% | 58.8% | 54.4% | ⬆ 5 |
| 14 | 80918 | 52.6% | 54.8% | 53.7% | ⬇ 3 |
| 15 | 80831 | 54.4% | 52.9% | 53.7% | ⬆ 10 |
| 16 | 80925 | 51.0% | 56.2% | 53.6% | ⬆ 6 |
| 17 | 80924 | 48.3% | 58.3% | 53.3% | ⬆ 13 |
| 18 | 80921 | 56.2% | 50.4% | 53.3% | ⬆ 9 |
| 19 | 80909 | 54.5% | 51.1% | 52.8% | ⬇ 17 |
| 20 | 80904 | 56.6% | 48.3% | 52.4% | ⬇ 7 |
| 21 | 80951 | 54.6% | 50.0% | 53.3% | ⬇ 5 |
| 22 | 80906 | 49.3% | 54.4% | 51.8% | ⬇ 7 |
| 23 | 80927 | 48.0% | 55.0% | 51.5% | ⬆ 6 |
| 24 | 80919 | 51.1% | 49.3% | 50.2% | ⬇ 1 |
| 25 | 80908 | 44.2% | 56.1% | 50.2% | ⬆ 1 |
| 26 | 80106 | 45.7% | 52.3% | 49.0% | ⬇ 16 |
| 27 | 80132 | 48.3% | 49.6% | 49.0% | ⬆ 1 |
| 28 | 80920 | 43.1% | 54.6% | 48.9% | ⬇ 4 |
| 29 | 80903 | 35.6% | 59.2% | 47.4% | ⬇ 25 |
| 30 | 80905 | 39.3% | 43.0% | 40.6% | ⬇ 16 |
* The column that says "PPSF" stands for price-per-square-foot. The sales prices are based on the median sale price for each zip code.
As you'll see in the infographic above, different neighborhoods in Colorado Springs have varying rates of market appreciation. Some areas will appreciate faster than others. One thing is certain: every part of Colorado Springs has appreciated. The lowest zip code on the list still increased by 40.6% over the last five years.
The average annual inflation rate for real estate in America has averaged 4.61% over the last 30 years. Our lowest appreciating zip code in Colorado Springs is appreciated at a rate of 8.0% per year. Every zip code in Colorado Springs gained equity at a rate higher than the national average for the last five years. That's an impressive claim.
Home prices have leveled out over the past two years. Let's take a look at the last ten years of sales history in the Pikes Peak region to better understand exactly how much our market has grown. These numbers are current as of March 2024.
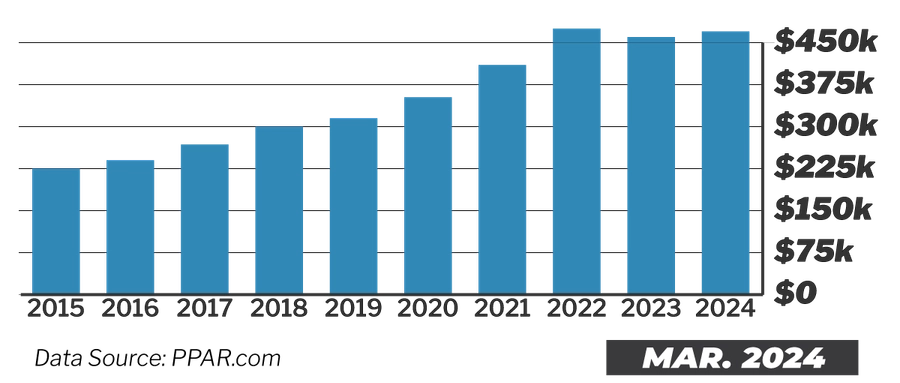
Notice how Colorado Springs has appreciated nearly every year since 2015, but then dropped in 2023. Home prices are relatively flat right now.
We are in a strange market right now. Here is a chart showing our home sales over the last ten years.
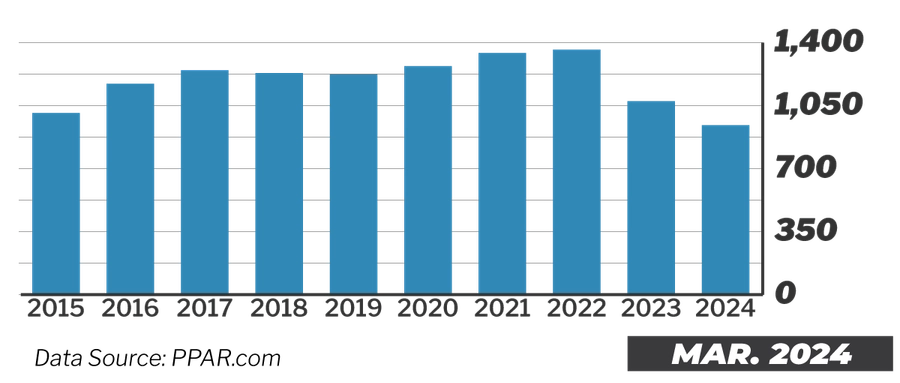
We sold the fewest homes in 10 years in March of 2024. Sales have slowed down, but our inventory is still low. This is keeping home prices flat. If inventory increases, home prices will start to drop.
There are multiple conclusions to consider when reviewing the data.
We identified three main points of interest from our collected data.
Homes near the city's epicenter tend to have higher demand, but that has changed in the last few years in Colorado Springs. Homes in the upper price ranges tend to have less demand, as fewer people can afford them. Also, newly built homes sell for 10% to 20% more than existing homes, so they tend to appreciate more slowly in the first few years.
This data can yield more interesting facts. For instance, if a person bought two investment properties five years ago in zip code 80915, they probably would experience more appreciation than someone who bought a high-end home in zip code 80920 at the same time.
Everyone wants to know the answer to this question, but the honest answer is that no one knows. This data is provided as a point of reference but not as a guarantee of the future.
This data does not guarantee that you can invest in real estate near downtown Colorado Springs and do better than in Northgate or Black Forest. It's general information about every home sold within our local MLS. Multiple factors can affect a home's appreciation, which is not part of this study.
Specific deals within every area do not always conform to these averages. We advise you to work with a great Realtor who knows the market well and can help you navigate each neighborhood to ensure you make the best decisions.
Every month, we put out the Colorado Springs Market Insider. You can view it by clicking the image below. You'll find the most recent housing market statistics for Colorado Springs right here.
If you subscribe to any of our social media profiles, you'll receive our newest videos in your news feed as soon as we post them. Our website and Facebook page are the best ways to stay up to date on our crazy market shifts.
We also recommend finding an excellent Realtor with enough experience to navigate our current market conditions. Your realtor's skillset and expertise have never been more vital.
Whether buying or selling a home, you need an excellent Realtor. Finding the right agent will be one of the critical factors to your success in this crazy real estate market.

Colorado Springs is a haven for outdoor enthusiasts and a paradise for our four-legged friends. With its sweeping landscapes, dog-friendly communities, and many activities, this city and its surroundings offer a paw-some experience for you and your furry companion. There are many dog parks in Colorado Springs, but we're going to cover the best ones to save you some time.My partner Tom and I have

Getting your home ready for a real estate photoshoot can feel overwhelming. The day your photographer arrives is often one of the most nerve-wracking moments in the selling process. Suddenly, every detail needs to be perfect, and that pressure can be intense.As a photographer, I've seen homeowners scrambling to finish up just as I arrive. It’s not uncommon to find sellers dashing around, putting
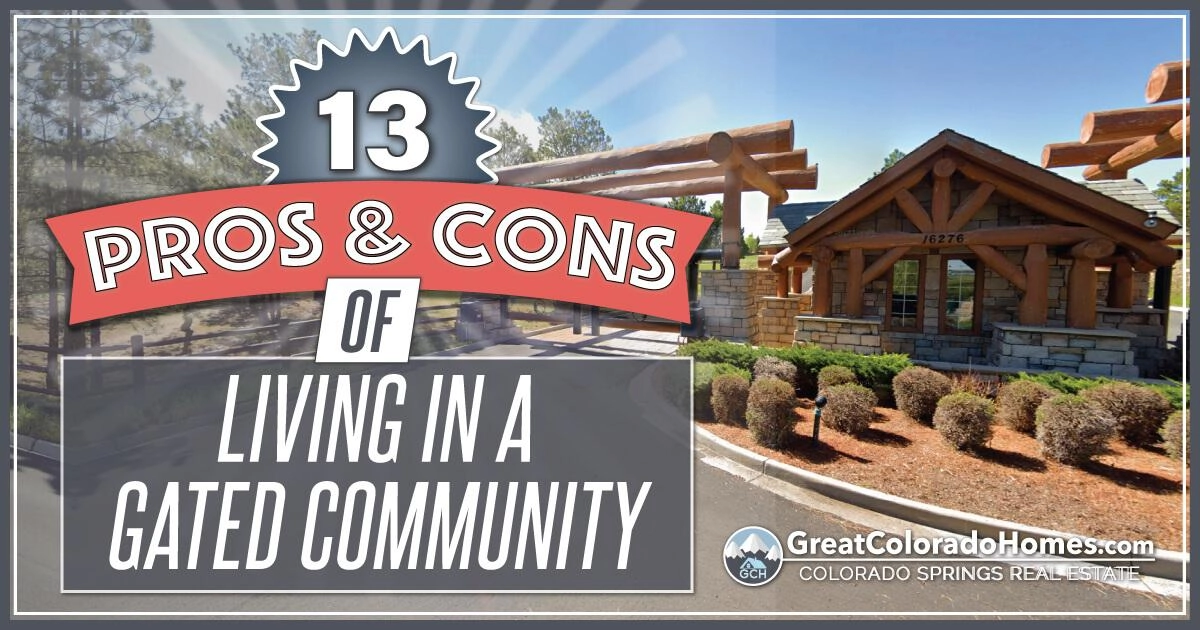
Living in a gated community can sound simple from the outside. You picture a private entrance, quieter streets, nicer landscaping, and fewer people driving through the neighborhood without a reason. After living in a gated community myself and working with buyers around Colorado Springs, I can tell you the real answer is more balanced.Some buyers love the structure, privacy, and amenities. Others
.png)
Which home upgrades add the most value and ROI when selling? We'll cover all of the current home-updating options to help you choose.If you already know the projects that you want to do, you can use this home improvement calculator to get accurate estimates. If you need ideas and inspiration to find the best home improvement projects to add value to your home, this article is for you.Around 61% o
.png)